Ensuring Data Quality through Metadata Governance
Data leaders are being asked to do two hard things at once: move faster and reduce risk. Self-service analytics, AI, regulatory scrutiny, and distributed architectures (cloud, data mesh, lakehouse) have made the old “central team fixes everything” approach obsolete. Quality and control must be designed into the way data is created and used, both at the edges, as well as the core.
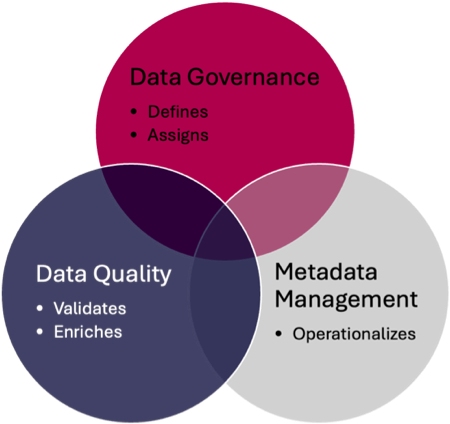
That’s where the intersection of Data Governance (DG), Metadata Management (MDMgt), and Data Quality (DQ) becomes decisive: DG clarifies accountability and defines the policies and standards; MDMgt captures and connects context, definitions, owners, lineage, classifications; and DQ turns policies and definitions into measurable rules with thresholds, monitoring, and remediation. Together they enable metadata-driven quality.
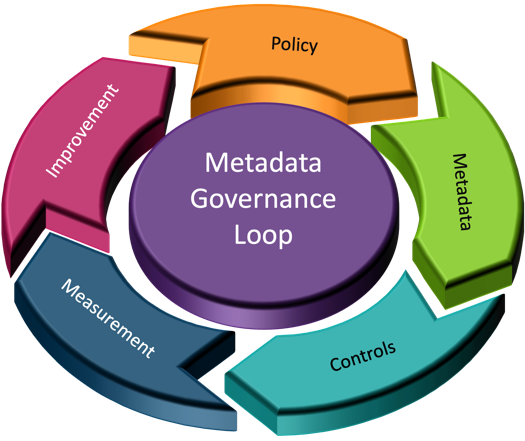
Operating Logic: Policy → Metadata → Controls → Measurement → Improvement
This section describes the closed‑loop flow that makes policies executable and quality observable across the lifecycle.
- Policy (DG): Define business policies and standards (e.g., “Customer email must be valid and unique before onboarding.”).
- Metadata (MDMgt): Encode the policy as structured metadata, such as terms, standards, criticality (CDEs), lineage, and classifications.
- Controls (DQ + DG): Implement metadata-driven controls, such as quality rules bound to terms and fields; validation steps; access and masking tied to classification.
- Measurement (DQ): Monitor against thresholds; publish data quality scores and trends to the catalog and dashboards that get stored as metadata.
- Improvement (DG + DQ): Exceptions trigger stewardship workflows; RCA updates standards, rules, and processes; controls are strengthened.
How Each Discipline Complements the Others
We break down how governance, metadata, and data quality reinforce one another rather than competing for attention or budget.
Governance amplifies Quality
Governance turns aspirations into obligations by assigning decision rights, thresholds, and accountability for data quality. Policies become measurable obligations when translated into quality rules with owners and SLAs. Governance sets decision rights and aligns quality with risk.
Metadata operationalizes Governance
Metadata translates policy into discoverable, machine‑readable context so controls can be automated and reused. Business terms, lineage, and policy-as-data reduce ambiguity and make enforcement repeatable and automatable.
Data Quality validates Governance and enriches Metadata
Quality metrics provide evidence that policies work and generate new metadata that improves definitions and rules. DQ metrics prove whether policies are effective, feed better standards, and produce living metadata like scores and exception logs.
The Metadata You Actually Need (and Why)
Focus on the small set of metadata that connects policy to practice and drives real improvements in quality and compliance.
- Business Glossary Terms with definitions, stewards/owners, examples, and linked policies.
- Critical Data Elements (CDEs) with criticality tiers, quality dimensions, and thresholds/SLOs.
- Technical Metadata schemas, data types, constraints, keys, statistics to enforce and validate rules.
- End-to-end Lineage across ingestion, transformation, storage, and presentation, including job metadata.
- Security & Privacy Classifications with handling instructions (masking, retention, lawful basis).
- Data Quality Artifacts as metadata: profiling results, rules, thresholds, scores, exception logs.
- Reference & Master Data links to controlled vocabularies, code sets, and master records.
- Operational Metadata: freshness, change frequency, volumes, error counts, drift signals.
A Lightweight Operating Model (RACI-aware)
These roles and responsibilities keep stewardship federated yet coherent, so improvements happen close to the data. Data Owner (Business) is accountable for value and risk; Data Steward defines terms and rules; Technical Steward/Data Architect implements enforcement; Data Engineer automates execution and observability; Data Consumer provides feedback; DG Council prioritizes and tracks maturity.
R (Responsible): Stewards & Engineers. A (Accountable): Data Owners. C (Consulted): Security/Privacy/Legal. I (Informed): Consumers.

Lifecycle Perspective: Plan → Design → Build → Operate → Monitor → Improve
Use this lifecycle to embed governance, metadata, and quality activities from planning through continuous improvement.
Plan
Decide what matters most, who owns it, and which standards and SLOs will guide the work.
- Identify critical domains and CDEs.
- Set policy priorities, risk posture, and target SLOs for quality.
- Choose toolchain patterns (catalog, lineage, rules, observability).
Design
Translate policies into definitions, rules, models, and classifications that systems and people can execute.
- Create or refine business terms; map to logical/physical models.
- Specify DQ rules per CDE (dimension, logic, threshold, owner).
- Define privacy classifications and access/masking rules.
Build
Implement validations, lineage capture, and monitoring as part of normal pipeline and model delivery.
- Implement validation in pipelines; bind rules to metadata objects.
- Capture lineage automatically; publish to catalog.
- Configure profiling, sampling, and anomaly detection jobs.
Operate
Run with visibility, surface health, enforce access, and route exceptions to accountable stewards.
- Surface data health indicators in BI/ML workspaces.
- Route exceptions to stewards; enforce access/masking policies.
- Track freshness and SLA adherence.
Monitor
Measure performance against thresholds and SLAs, and correlate issues to data and pipeline events.
- Publish quality scorecards; trend over time.
- Alert when thresholds missed; correlate to pipeline events.
- Report policy compliance posture to DG Council.
Improve
Use root‑cause analysis to refine policies, designs, and controls so quality trends up over time.
- Run RCA; update definitions/standards.
- Tighten controls or adjust thresholds with Owner approval.
- Share reusable patterns (reference data, input masks).

Translating Policy into Tests: From English to Executable
Here we show how to convert narrative policies into structured, machine‑readable checks bound to metadata objects. Normalize policy statements into structured templates (statement, scope, dimensions, thresholds, owner, evidence); bind them to metadata objects (terms and physical fields); provide machine-readable logic (regex, SQL predicates, YAML); and store results as metadata so quality becomes self-documenting.
Quality Dimensions Mapped to Metadata Signals
This cheat‑sheet links each quality dimension to the metadata and controls that best signal it in practice.
- Accuracy: semantic constraints, reference/master linkages; evidence via match rates and exceptions.
- Completeness: mandatory fields and value domains; % non-null by critical fields.
- Consistency: canonical definitions, transformation standards, code sets; reconciliation checks.
- Validity: data type/format rules; allowed value sets; schema drift detection.
- Timeliness/Freshness: ingest timestamps, latency, SLA timers; alerts on staleness.
- Uniqueness: key patterns; duplicate detection metrics.
- Lineage Integrity: coverage and correctness; change impact verification.
Practical Example: Customer 360
A short narrative illustrates how the loop works from policy to measurement in a familiar customer domain. DG declares Customer a critical domain; MDMgt defines terms and maps them to systems with PII classification and lineage; DQ implements format checks, deduplication, and referential integrity; analysts consume a catalog entry with definitions, lineage, masking status, and a quality scorecard.
Metrics that Matter
Track a concise set of indicators that connect governance activities to business outcomes and trust.
- Coverage: % of critical datasets with defined terms, owners, and DQ rules.
- Adherence: % rules passing; time-to-detect/time-to-remediate exceptions.
- Consumer Confidence: trust/readiness ratings; ticket volume/aging.
- Business Impact: reduced fallout, faster onboarding, improved NPS, fewer compliance findings.
- Process Maturity: glossary adoption, lineage completeness, privacy classification coverage.
Common Anti-Patterns (and Fixes)
An anti-pattern is a common solution to a recurring problem that seems helpful at first but consistently makes things worse harder to maintain, riskier, or more expensive over time. Think of it as a “popular mistake with a name.” Avoid these traps that waste effort or hide results, and use the suggested fixes to stay on course.
- Collecting metadata for its own sake → Prioritize policy-to-control metadata; deprecate unused fields.
- Quality as a one-time cleanup → Institutionalize continuous monitoring with stewardship workflows.
- Centralized bottleneck → Adopt federated stewardship with guardrails and coaching.
- Invisible policies → Express standards in machine-readable forms; expose in the catalog; embed in CI/CD.
- No feedback loop → Publish DQ scores; review at governance forums; adjust thresholds and designs based on evidence.
- Tool sprawl → Integrate catalog ↔ lineage ↔ DQ engine ↔ ticketing; make the catalog the plane of glass.
Enablers and Patterns that Scale
Adopt these reusable patterns to make quality-by-design your default rather than a special project.
- Policy-as-Code: version and test rule sets like software.
- Data Product Contracts: declare schema, SLAs, and quality expectations; validate at boundaries.
- Golden Path Templates: onboarding checklists for terms → rules → lineage → monitoring.
- Reference Data Services: governed code sets for validity and consistency.
- Observability by Design: standardize ingest timestamps, counts, and drift checks.
- Human-Centered Catalogs: plain-English definitions, examples, owner contacts, and visible quality badges.
Governance Forums that Drive Outcomes
Keep meetings artifact‑driven and evidence‑based so decisions update metadata and controls—not just notes.
- Data Domain Councils: own domain roadmaps; prioritize CDEs; resolve cross-team issues.
- Steward Guilds: share rule patterns and playbooks; review exceptions and RCA learnings.
- Quality Review: monthly dashboard of domain-level quality and actions.
- Risk & Compliance Sync: validate classifications, retention, and access rules; review findings.
A Phased Roadmap (90/180/365 days)
Use this time‑boxed plan to show momentum quickly, then scale responsibly across domains and platforms.
First 90 days
Start small and visible—stand up glossary, lineage, and a handful of high‑value rules with active stewardship.
- Stand up the glossary and lineage for 2–3 critical domains.
- Identify top 10 CDEs per domain; define owners, dimensions, thresholds.
- Implement 3–5 high-value rules per domain; publish scorecards.
- Connect exceptions to a ticketing flow owned by stewards.
By 180 days
Broaden coverage, automate the basics in CI/CD, and harden privacy and access controls across PII.
- Expand to 5–7 domains; ≥ 80% CDE coverage with active monitoring.
- Add privacy classifications and masking to all PII terms; link to access controls.
- Automate profiling and drift checks in CI/CD for new datasets.
- Introduce data product contracts with interface validations.
By 12 months
Institutionalize policy‑as‑code, increase lineage coverage, and report measurable business impact.
- Institutionalize policy-as-code; version, test, and roll back rule sets.
- Publish business impact metrics (before/after improvements).
- Lineage coverage > 85% for Tier-1 pipelines; enable change impact analysis.
- Quarterly governance reviews tune thresholds/SLOs and standards from evidence.
Short Case Snapshots
These brief stories show how the approach plays out in regulated, clinical, and retail contexts.
Financial Services (KYC)
Tighter definitions, lineage, and rules reduce onboarding friction while improving auditability.
Issue: Inconsistent customer identity across channels caused KYC failures and rework.
Intervention: Declared Customer Identity CDEs; standardized definitions; dedupe/validity rules; lineage visibility.
Result: 40% reduction in KYC exceptions; onboarding time reduced; improved audit traceability.
Healthcare (Patient Matching)
Governed matching and reference data reduce duplicates and clinical risk while improving billing accuracy.
Issue: Duplicate patient records led to clinical risk and billing errors.
Intervention: Governed matching thresholds and reference data; visible quality scores; improved capture forms.
Result: Duplicate rate dropped from 4% to <1%; fewer denied claims; better clinical continuity.
Retail (Product Catalog)
Mandatory attributes and supplier contracts lift findability and conversion while cutting disputes.
Issue: Incomplete product attributes weakened search and returns handling.
Intervention: Mandatory attribute sets; supplier contracts; automated completeness checks at ingest.
Result: Better search conversion; fewer disputes; faster SKU onboarding.
Positioning Quest erwin Data Intelligence & Data Modeler Against the Patterns
This section maps Quest erwin DI and Data Modeler to the loop—DI as the governance & observability fabric; DM as the design & control fabric.
Make the catalog the front door.
- erwin Data Intelligence (DI) serves as the enterprise catalog and governance plane: harvests technical metadata, enriches with business context, exposes lineage/impact, and supports glossary/policy workflows so both people and automation can find, understand, and use trusted data.
- Express policy as metadata, then execute.
- erwin DI provides business glossary, policy, and rule management with review/approval workflows. Policies, terms, classifications, and handling rules are first‑class metadata objects for consistent enforcement across pipelines and tools.
- Wire quality into the loop (measure→improve).
- erwin DI surfaces integrated data quality: profiling results and data-quality scores in the catalog/lineage views; can incorporate partner DQ engines; quality becomes visible where decisions are made.
Trace policy to outcome with lineage.
- erwin DI captures end‑to‑end lineage (technical and business) and links it to governance artifacts (terms, policies, quality scores) for impact analysis, auditability, and triage.
- Golden paths for onboarding data products.
- erwin DI automates metadata harvesting/mapping so new datasets are onboarded with terms, classifications, lineage, and initial quality checks from day one.
- Model once, implement many (design→build).
- erwin Data Modeler (DM) is the design authority: define canonical entities, keys, constraints, and standards at the logical level; generate/synchronize physical models across platforms—codifying validity/uniqueness/consistency directly in schemas.
Close the loop between models and the catalog.
- Together, DM → DI provides bi‑directional leverage: models inform the catalog with authoritative structures; DI’s lineage/quality insights drive model refactoring and standards updates—your policy → metadata → controls → measurement → improvement loop in action.
In practice: author terms and CDE thresholds in DI; design keys and constraints in DM; harvest lineage and surface quality in DI; iterate standards in DM based on DI signals. Net effect: metadata‑driven quality with transparent governance and executable design.
Conclusion: Make Quality a Property, not a Project
Ensuring data quality through metadata governance is about baking trust into how data is defined, produced, and consumed. Data Governance sets standards and accountability; Metadata Management makes those standards discoverable and executable; Data Quality measures and improves outcomes. When integrated, policies become living artifacts that guide pipelines, dashboards, and machine learning—not static documents hoping to be obeyed. Platforms such as Quest erwin Data Intelligence and erwin Data Modeler help operationalize this loop: DI as the governance and observability fabric (glossary, policy, lineage, and quality visibility), and DM as the design and control fabric (logical/physical standards and constraints). Start with your most critical data, express policies as metadata, wire rules into pipelines, make quality visible, and iterate.